Interactive charts for dashboards with real data volume.
Charts across three demos: treemaps, choropleths, trees and time series.
Where it was used 03
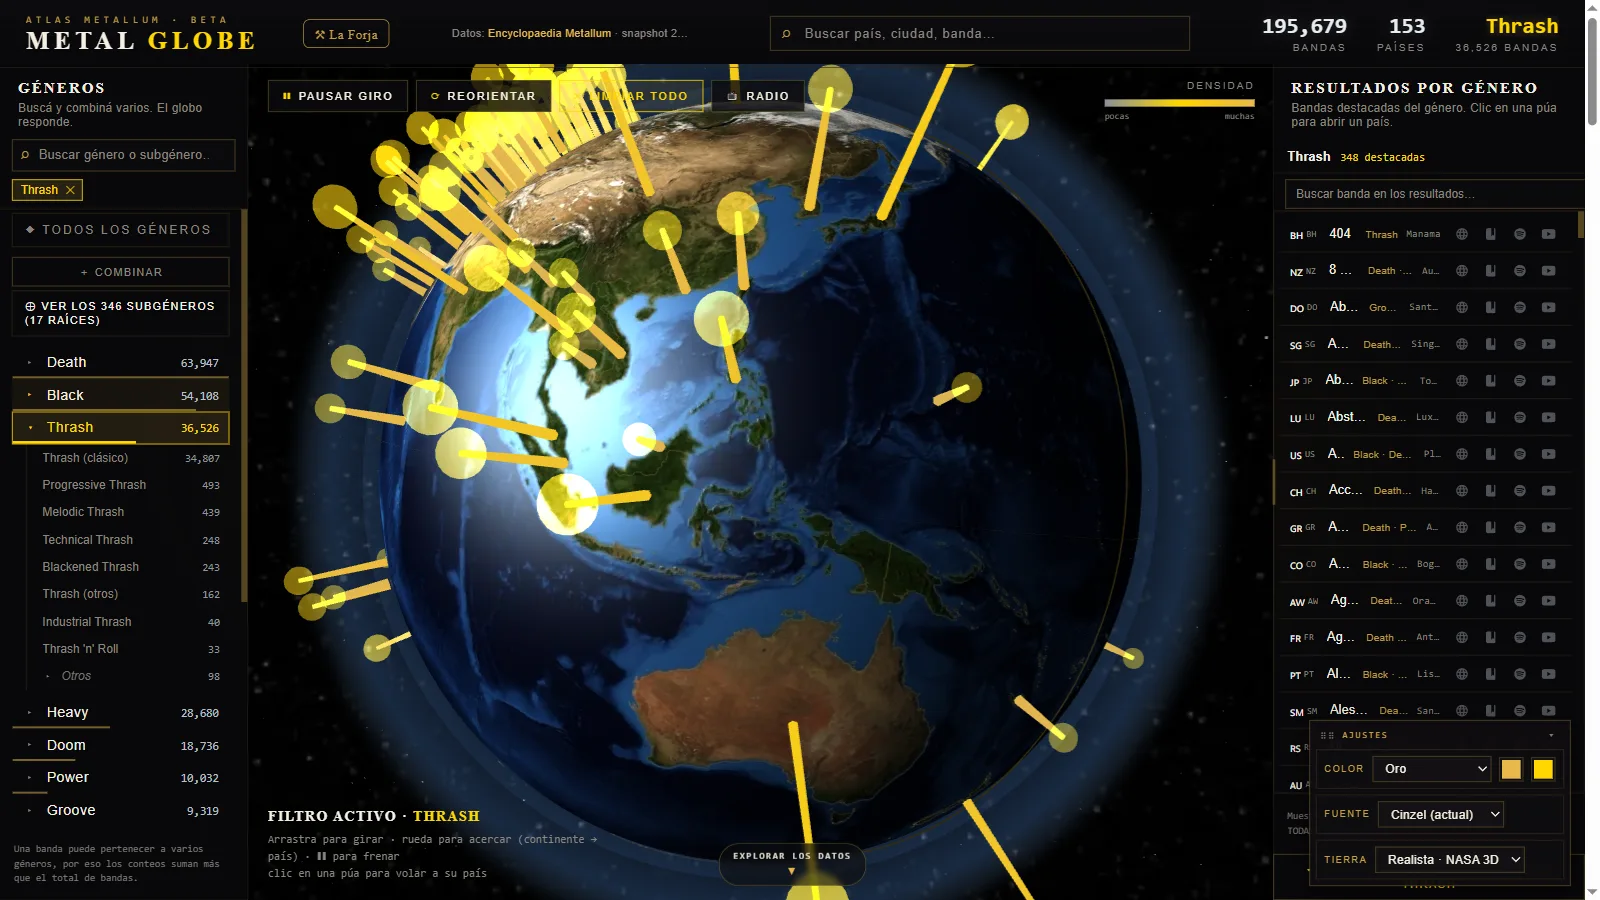
- Metal Globe
The genre treemap next to the globe, plus the dashboard charts.
- Monitor de Commodities
Spread, correlations, HHI and projection, all vendored with no external CDN.
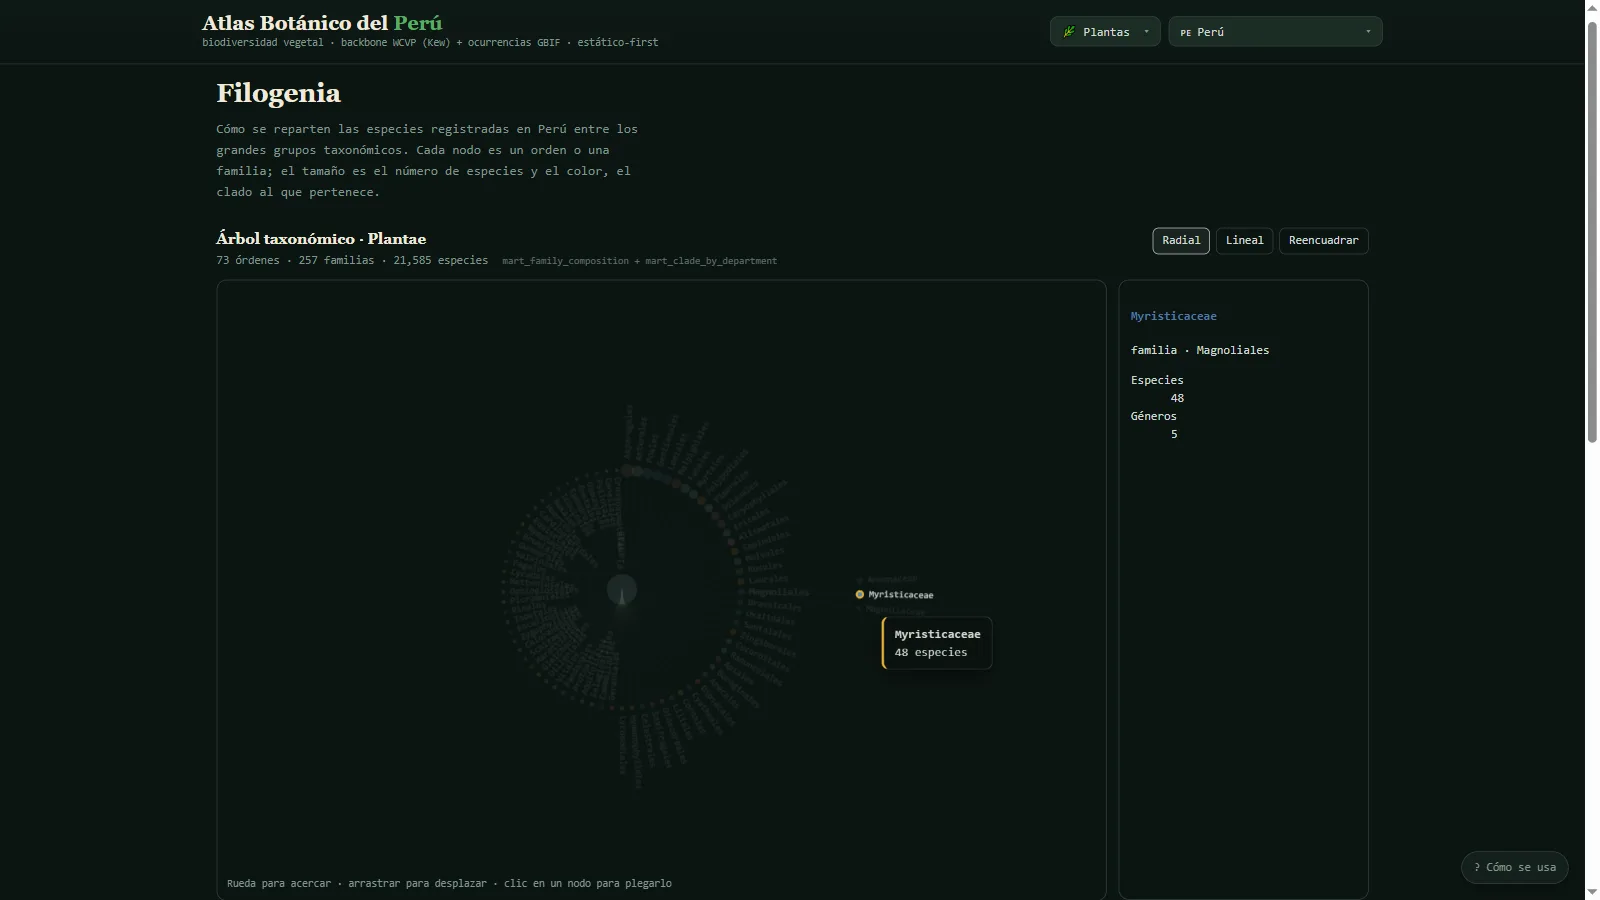
- Atlas Botánico del Perú
Choropleth by department and the navigable taxonomic tree with zoom and pan.
Web & product
Metal Globe
I put 195,679 metal bands on a 3D globe, filterable by country, genre and decade.
three.js · 4,408 → 496 lines, split into data.js · lazy-loaded flags · static
Markets & comparators
Monitor de Commodities
I track the sugar-crude spread against a timeline of 6 dated events that explain the jumps.
Science & bioinformatics
Atlas Botánico del Perú
I turned raw GBIF data into a tree of Peru's 21,585 accepted plant species that opens in the browser.
DuckDB · 1.28M GBIF records · ten-stage ETL · static marts, no backend
- DuckDB
- ET ETL
- Astro
- Apache ECharts
- Python
- +2
Same category